

Dwell volume, Dead volume and Void volume
Table of Contents
- Introduction and Background
- Dwell volume and its functions
- Measurement of the Dwell volume
- Dead volume and its functions
- Difference between Void volume and Dead volume
- Void peak or unretained peak
- Advantages of unretained peak
- Chromatogram and peak
- Difference between the chromatogram and the peak
- Retention time and Relative Retention time
- Conclusion
Introduction and Background
Dwell volume, Dead volume and Void volume play a vital role in chromatographic method development. Due to a lack of clarity analytical chemists do not use these terms effectively while developing the analytical method. That is why I decided to share my skill-based knowledge on Dwell volume, Dead volume, Void volume, Chromatogram, Peak, Unretained peak, Retention time and Relative retention time. Having read this post all your doubts will be cleared and you will be able to answer questions like:
- What is dead volume and how it is measured?
- What is the dwell volume and how it is measured?
- What is the void volume and how it is calculated?
- What is the void volume peak or unretained peak and how it is calculated?
- What is the chromatogram?
- What is the peak?
- What is the retention time?
- What is the relative retention time?
- What is the capacity factor and how it is calculated?
Dwell volume, Dead volume, Void volume, Chromatogram, Peak, Unretained peak, Retention time and relative retention time
Dwell volume and its functions
The dwell volume is the volume of the mobile phase of the gradient HPLC system between the mixing chamber and column inlet. It is also called Gradient delay volume. It is denoted by VD. It is the primary function of the pump.
- It is responsible for delay for a gradient
- It impacts on separation of different components in gradient mode
- If two systems have different dwell volumes then there may be variation in retention time using the same chromatographic method/condition
- It does not impact on separation in isocratic mode
- Lower is the dead volume better is the instrument
- It is not related to HPLC column and consequently Volume of the void space of the column is not considered in the Dwell volume.
Dwell volume = Mobile phase or Solvent volume of the {gradient mixture + connecting tubing between gradient mixture and pump + pump head + check valve + connecting tubing between pump and injector + injector + connecting tubing between injector and column inlet}
Measurement of the Dwell volume
The following mobile phase (Table-1), chromatographic condition (Table-2), formula (equation-1 and equation-2) and gradient curve (figure -1) are used to calculate the Dwell volume.
Mobile phase gradient
| Time (minute) | Mobile phase A – water (V/V) | Mobile phase A – 0.1% Acetonitrile (V/V) |
| 0 | 100 | 0 |
| 20 | 0 | 100 |
| 30 | 0 | 100 |
Chromatographic condition
| Column | (1m x 0.12mm), PEEK capillary tubing can be used |
| Flow rate | 2ml/minute |
| Wavelength | 265nm |
Dwell volume (D) can be calculated by following formula
D = tD x F (equation -1)
Where: D is the Dwell volume, F is flow rate and tD is the Dwell time
Dwell time (tD) calculation procedure
tD can be calculated by following formula:
tD = t50 -1/2 tG or tD = t50 -0.5 tG (equation -2)
Where:
- G is 20 minutes (see gradient, table-1),
- t0.5 is the time in minutes when absorbance has increased by 50% (see figure xx)
tD measurement procedure
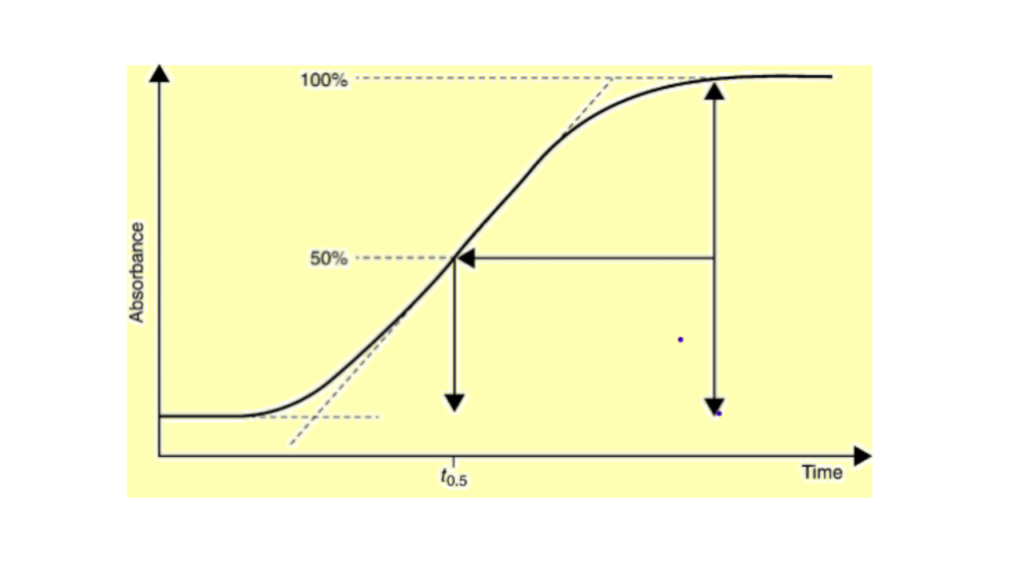
Once the gradient is completed the chromatogram looks like as in figure-1. The initial flat baseline represents 0% acetone (100%A) and the final baseline is 0.1% acetone (100% B). The sloping line is the transition between the two. The following approaches are used to calculate the Dwell time (tD).
- Approach-1: Draw a line through the gradient portion of the curve, extending below the baseline (dashed line figure – 1). Next, extend the initial baseline until it intersects the line. The intersection represents the Dwell time tD of the system. Now D can easily be calculated using equation -1. If tD is 0.85 then D will be; D = tD x F, D = 0.85 x 2 = 1.7
- Approach 2: Measure the offset between the low and high baseline and find the midpoint. Extend a line from the midpoint horizontally until it intersects the rising baseline. From this intersection, drop a line vertically to the time axis. Subtract half of the gradient time (20 minutes/2 = 10 minutes in the present case). The remaining time is the Dwell time (tD). Now D can easily be calculated using equation -1 same as the above procedure (Approach-1)
Dead volume and its functions
The Dead volume is the volume of the mobile phase of the HPLC system between point injection to point of detection. The volume of the void space of the column/column is not considered in the dead volume.
- It is applicable for both gradient and isocratic system.
- It is not related to HPLC column and consequently volume of the void space of the column is not considered in the Dead volume
- Lower is the dead volume better is the instrument
Measurement of Dead volume
The Dead volume can be measured by replacing the column with a zero dead volume connector or union
Procedure
- Inject the the sample (at minimum concertation) and note down injection time
- Note down the peak elution time
Dead volume = (t – to)x Flow rate (equation-3)
Where : t = time of injection and to = Peak elution time
Void volume
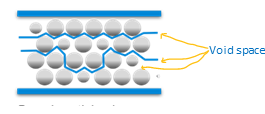
In the HPLC column, some of the space between the stationary phase is not occupied by the stationary phase that space is called void space. The same void space can be occupied by solvent or mobile phase.
The volume of the solvent/mobile phase in a liquid chromatography column is called the Void volume. In another way, we can say that the void volume is the volume of the column not occupied by the support particles. It includes volume between the particles as well as volumes of the pores of the particle. It is denoted by V.
Void volume is calculated by the following formula:
Void volume Calculation (equation -4)
t0 = Void volume/Flow rate of the mobile phase
Where:
- V = Void volume
- d = internal diameter of the column
- l = length of the column
- f = pore volume. It is 0.70 for fully porous packing and 0.50 for superficially porous packing
Case study: Suppose column dimension is (150 x 2.1)mm and f is 0.70. Then void volume will be:
V = 3.14159265359 x (2.1)2 x 150 x (0.70/4) = 0.37ml
V can also be calculated using following formula :
V = to x Flow rate of the mobile phase
Where to is the retention time (RT of the unretained peak
Difference between Void volume and Dead volume
| Void volume | Dead volume |
| The volume of the solvent/mobile phase in a liquid chromatography column is called Void volume. In another way, we can say that the void volume is the volume of the column not occupied by the support particles. It includes volume between the particles as well as volumes of the pores of the particle. It is denoted by V | The Dead volume is the volume of the HPLC system between the point of injection and appointed detection without the column. |
| Volume of the tubing is not considered | Volume of column is not considered |
Void peak or unretained peak
The peak due to void volume is called void volume peak or unretained peak. it is denoted by to
Procedure for calculating Void volume peak or unretained peak
to can be calculated using the following procedure -1 and procedure-2
- Procedure -2: to can be calculated using the following formulae:
t0 = Void volume/Flow rate of the mobile phase
Case study: Suppose column dimension is (150 x 2.1)mm and flow rate of mobile phase is 0.2ml/minute. Then to will be (0.30/2) = 1.85 minute
- Procedure -2: to is also can also be calculated using unretained analytes like Uracil, KI… (in Reverse HPLC mode)
Advantages of unretained peak in HPLC method development
- Very helpful in HPLC method development
- Higher is the separation between unretained peak and peak of interest better is the method
- It is helpful in calculating capacity factor
Chromatogram and peak
Chromatogram
It is a two dimensional graphical representation of the concentration of the analyte/analytes. The x-axis represents time and the y – axis represents analyte concentration in terms of detector response.
Peak
When the analyte goes into the detector, the detector converts it into the signal and sends that signal to the data processor and the data process converts that signal into the peak.
The peak is a two-dimensional graphical representation of the concentration of the analyte in the chromatogram. The x-axis represents time and the y – axis represents analyte concentration in terms of detector response.The peak should be Gaussian or bell-shaped.
Difference between the chromatogram and the peak
One chromatogram contains multiple peaks where one peak represents only one analyte or concentration of one analyte.
Case studies: If the sample mixture contains phenol and Benzoic then its chromatogram will contain two peaks; one for Benzoic acid and a second for Phenol
Retention time and Relative retention time
Retention time
The time at which peak analyte elutes in the chromatogram as a peak is called Retention time. It is denoted by RT
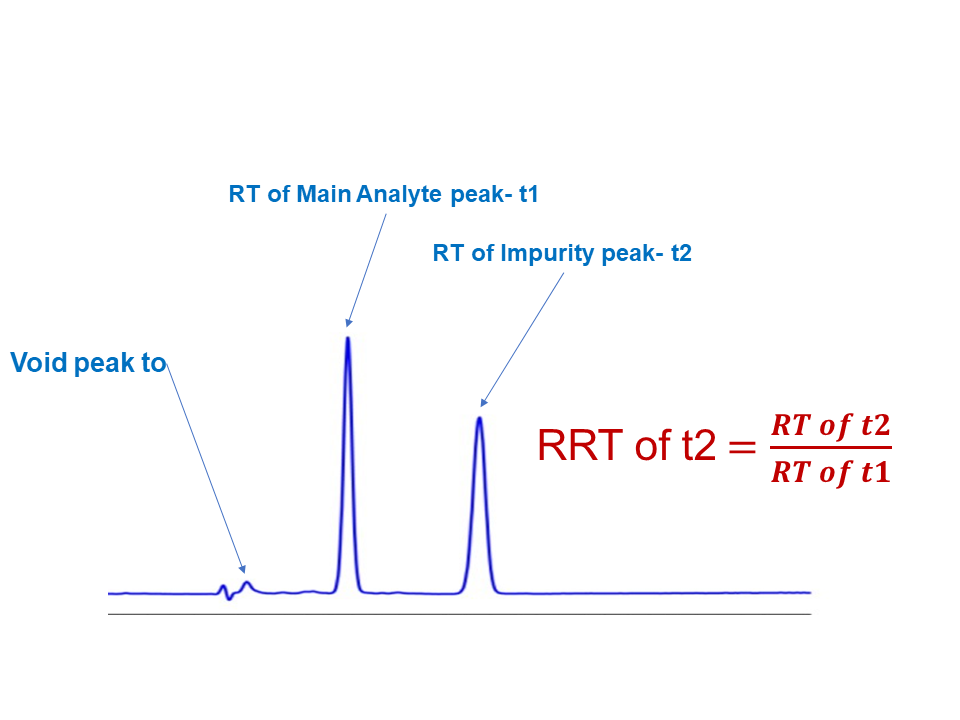
Relative retention time
It is the relative location of two peaks. Generally, the relative location of the impurity peak or any other peak is calculated against the main analyte peak. Hence we can say that Relative retention time is the ratio of the retention time of an impurity peak and the retention time of the main peak. It is denoted by RRT.
RRT = RT of impurity peak/RT of main peak
Conclusion
Chromatographic terms “Dead volume, Dwell volume, Void volume, chromatogram, peak, unretained peak, Retention time and Relative retention time are used in chromatographic analysis. development. Now I can hope that all your doubts have been cleared related to these terms. Please write your review or question in the comment section and I will answer the same on a priority basis.
You may also want to check out other articles on my blog, such as:
- Difference between HPLC and GC
- How to develop a method using GC-MS?
- Need of Chromatographic Method in Drug Development
- What is the Chiral Gas Chromatography?
- How to decide system suitability test (SST)?
- Allowable GC Method Adjustment
- How to develop the HPLC method for basic compounds?
- How to develop the HPLC method for acidic compounds?
- How to develop the HPLC method for non-polar compounds?
- What should be the Analytical method development approach?
- GLP, GDP and OOS-OOT.
Abbreviations:
- RT: Retention time
- RRT: Relative retention time
- Void volume: V
- Dwell volume:
- to : Unretained time
References:
- IP
- USP
- BP
Lajawaab post. Very nicely and thouroughly explained. Regards
Lajawaab post. Very nicely and thoroughly explained. Regards
Really wonderful post sir. Framed and explained well.