How to Perform Linearity and Range in Analytical Method Validation
Introduction and outcome
Linearity and Range is one of the important parameter of analytical method. In this article, I will discuss procedure to perform linearity and range with case study
Procedure to perform Linearity and Range
Linearity for Related substances test
Prepare two stock solutions A and B. Now prepare five solutions in the concertation range of 50% to 150% using stock solution A and B. Inject each of these five solutions (once) and generate the chromatogram. Plot the linearity graph using concentrations in the X axis and their corresponding responses in the Y axis Calculate correlation coefficient (R2) and slope. R2 should be more than or equal to 0.997
Case studies
A drug substance D having the following specifications for related substances:
- Impurity A NMT: 0.20%
- Any unknown impurity NMT: 0.10%
- Total impurity NMT 0.50%
Sample concentration is 1.0mg/ml to perform related substances test and QL of the method is 0.05%
The following concentrations (≥5) can be prepared to perform linearity:
Impurity A solution concentration for Linearity calculation
The level of linearity and value of impurity A and their corresponding concertation have been calculated in the following table
| Level (L) | Impurity value (I) (0.20 x L/100 ) | Impurity solution concentration ( 1000 x I/100) |
| QL(0.05%) | 0.05% | 0.5mcg/ml |
| 50% | 0.10% | 1.0mcg/ml |
| 70% | 0.14% | 1.4mcg/ml |
| 100% | 0.20% | 2.0mcg/ml |
| 130% | 0.26% | 2.6mcg/ml |
| 150% | 0.30% | 3.0mcg/ml |
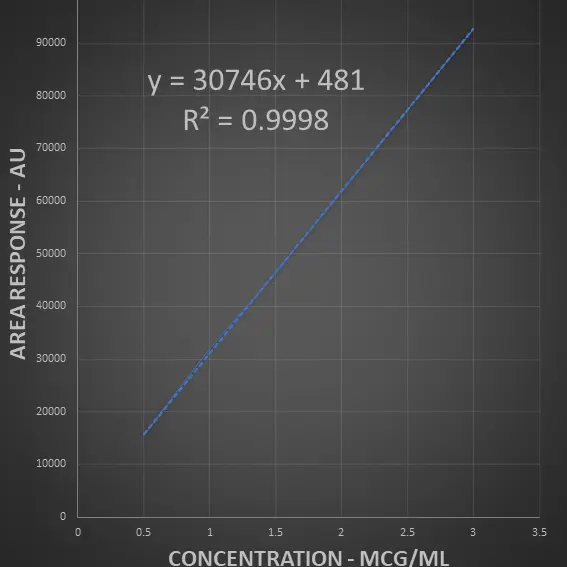
Inject Impurity A solution at each concentration as given in the above table and generate the chromatogram and note down the area response
| Impurity A ( mcg/ml) | Area response |
| 0.5 | 15457 |
| 1.0 | 31904 |
| 1.4 | 43400 |
| 2.0 | 61830 |
| 2.6 | 80380 |
| 3.0 | 92750 |
| Slope | 30746 |
| Correlation coefficient (R2) | 0.9993 ≥ 0.997 |
Acceptance Criteria: R2 is 0.9993 ≥ 0.997 and it passes the linearity criteria

Range
Impurity A is linear between 0.05% to 0.30% (QL to 150% of the specification limit).
Conclusion
Linearity is one of the important parameter of the Analytical method validation. It gives range in which method gives accurate and precise result. For any opinion or suggestions related to this article, you can write in the comment section. For any further assistance you can contact me using contact form.
You may also want to check out other articles on my blog, such as:
- Analytical method mini-validation
- Analytical technology transfer
- Ultimate Guide in Analytical Method Validation
- How to perform Solution Stability
- How to calculate Recovery in AMF?
- How to perform precision
- How to perform DL and QL in AMV?
- How to perform Specificity?
- How to perform Accuracy?
- How to perform Robustness?
- The best practices of Analytical Method transfer
- How to perform Forced Degradation Studies?
- How to perform Photostability?
References
- https://www.chromatographyonline.com/view/limit-detection
- https://database.ich.org/sites/default/files/Q2%28R1%29%20Guideline.pdf
Abbreviations
- mcg: microgram
- ml: milli liter
- QL: Quantitation limit
Disclaimer: The numerical data used in the tables or calculations are not actual data. It is designed to explain the topic.


